We recently scoured scholarly journals, collegiate records, and data collected from self-reported social media profiles to perform a meta-analysis from various angles on the relationship between musical tastes and SAT scores.
With enough single-blind and self-reported data from large, randomized populations we were able to create interactive charts, graphs, and maps to explore this data and draw accurate conclusions. Although the conclusions are accurate on a generalized scale, the precision forces us to reiterate that we understand:
Although the conclusions are accurate on a generalized scale, the precision forces us to reiterate that we understand:
Correlation does not equal causation.
But it also does not not equal causation either… I don’t know about you but I’ll take any edge I can get (as long as it’s legal and nobody gets hurt).
If You’re a Fan of Pop & Rap, I Feel Sorry For Your SAT Score
I kid, of course. I loved these genres and did just fine. But will you? That’s the tricky part about data ranges, averages, medians, and correlation… Take a peek at this data:
These charts are interactive! Hover regions to uncover more info.
As you can see, you don’t HAVE to be a fan of classical music to ace the SAT… but it sure helps. It’s pretty obvious what hurts, too. Note the Nationwide Average running up the center of the cluster.
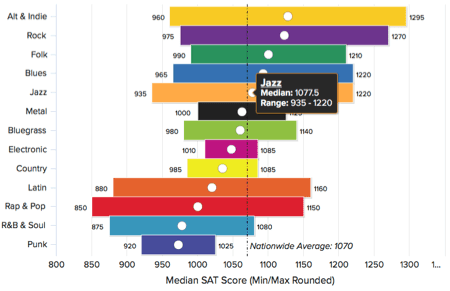
Above we can see how common of a cloth each genre’s community is cut from based on the breadth of their SAT score ranges. We can also create a rudimentary comparison based on the median scores. These colors act as the legend for all three charts.
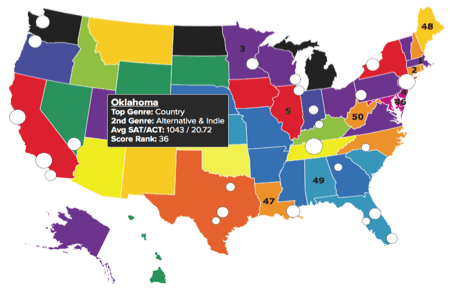
And finally, by mapping the data across the country we can measure how accurate the data is based on each state’s favorite genres. We also show the top 25 music production centers in the country, for reasons explained below.
Why Does Musical Taste Matter?
As high school students most of us are (or were) mainly concerned with two things: the genre of music we identify with that helps us build our identities, and the impending doom or success of taking the SAT.
It goes without saying… our SAT scores are the gate keepers to our future. To some it determines if we will be accepted into college at all. For others scholarships are hanging in the balance.
And for others still we need to do well so we can get into the ivy league school of our dreams or get into the school to which our best friends have all been accepted. It’s a big deal for everyone.
My own parents made me take the test twice to see if I could improve. All of this focus and effort is placed on the test outcome and yet we willfully gloss over the variables that have hidden impacts on our ability to slay the SAT dragon. One of those variables is our taste in music.
“Listening to Bjork is a sign of high intelligence, while listening to Lynyrd Skynyrd is a sign of low intelligence.”
Music isn’t a flavor of the week passion that comes and goes. We tend to rarely venture far outside of our preferential genres, and even as we grow older we tend to enjoy the nostalgia of listening to our own brand of the oldies.
It is true that we choose our genres based on what speaks to our personalities, but in turn these genres mold our personalities too, especially in our formative years. That doesn’t appear to affect our intelligence levels in any way, more so reveal something about them (in the aggregate).
YOU DON’T HAVE TO BE A CLASSICAL MUSIC FAN TO ACE THE SAT…
For instance, an intellectually-inclined, right-brained individual who excels in the sciences may enjoy the mathematics of progressive rock, counting out the beats of advanced time signatures dancing from key to key. And at the same time this person may enjoy the multi-syllabic nature of complex rhyme schemes in rap music as well.
At the same time the medium of rap tends to lend itself to emotionally shallow and surface level vocals that further impedes this person from learning how to dance in the subtlety of symbolic communication and expression.
YOUR TASTE IN MUSIC: EARLY WARNING SIGNS OF FLUNKING THE SAT
It goes beyond what intellectual and emotional skills are strengthened or weakened and ventures into cultural impacts as well. Another example: a person from a disenfranchised socio-economic background may have social pressures to identify with certain genres and even reject others as unfit for such a lifestyle.
A restricted exposure to expanded vocabularies, emotional vulnerability, and mature works of music theory will certainly have an academic impact, even as far as pushing against learning from authority and seeking self-study.
ARE YOU DOOMED TO FLUNK THE SAT? WELL, WHAT KIND OF MUSIC DO YOU LIKE?
The fact is, generally speaking, some genres focus on the surface-level experiences of consumerism and egotism. Others are angsty and depressive. Some are counter-culture, revolutionary, and angry.
Some explore the philosophical implications of the human condition, relationships, and responsibility. Only those with a high enough level of awareness will remain uninfluenced, and quite frankly very few high school students have achieved this attainment.
Interpreting the SAT & Music Data
Here we will walk through the data to explain what is being shown and what conclusions may be drawn from it.
THE ARTIST/GENRE SCATTER PLOT

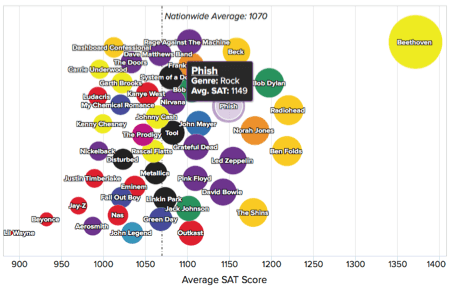
The first chart is largely for fun since it represents only a fraction of the data used for the subsequent calculations. The challenge was representing each genre equally while using recognizable artist names in such a small visual area.
Other restrictions included genres where not enough data was available and using dissociated definitions for these genres-at-large.
An example would be that one could argue that Garage, Post-Punk, and Emo are distinct genres, yet we’ve included them all under the heading of Punk. One could argue the same for Alternative and Independent, which we’ve combined as Alt & Indie.
What this chart serves to show is how the calculations were achieved for the second interactive graph. This scatter plot, when enough artists in similar genres are displayed and color-coded, shows that clusters form around certain data ranges. These ranges represent the average SAT scores of each artist fan-base, with the lowest scores on the left and the highest on the right.
What becomes clear is that the fans of sophisticated and musically articulate artists such as Beethoven, Radiohead, and Bob Dylan score well above the national average of 1070.
Fans of purposefully simplistic, repetitive, and marketably shallow artists such as Lil Wayne, Beyonce, Nickelback, and Carrie Underwood fall immensely behind the curve.
Do other artist fan-bases in the same genres perform similarly on the SAT?
THE GENRE COLUMN RANGE GRAPH

This is where things become interesting. Averages rarely tell the full story because with enough data points they eliminate outliers. It is important to view ranges and medians as well in order to understand the collective spread of a expansive group of individuals.
By stacking the genres bottom-to-top from the lowest median SAT score to the highest, we can see which genre attracts the fans that typically score higher on the test.
By focusing on ranges instead of medians, we can deduce two factors that interfere or contribute to our ability to draw further conclusions. These are:
- The popularity of the genre
- The cultural “tightness” of each community
Although it would be difficult to state with any specificity that Jazz or Latin music is more popular than the Country genre, we can deduce that the Country sound and the content of its lyrics creates a more inclusive culture.
It’s willingness to be vastly concerned with identity ostracizes many could-be listeners. The result is a very cohesive in-group of like-minded individuals, as seen from the relatively tiny variation in their minimum and maximum SAT scores.
Punk and Metal are both great additional examples of the inclusivity of their cultures. Rock and Rap & Pop, on the other hand, speak in generalities in order to appeal to (and attract) a larger fanbase. It is no surprise that there is a larger range of scores being measured by those who self-report enjoyment of those genres.
THE UNITED STATES SAT / MMI MAP

The map serves to visually disprove some of the egoic conclusions that could arise out of cognitive bias. When you hover over each state, you will find the 1st and 2nd most popular genres in the state, the student’s average SAT and ACT scores, and their rank out of 50 (with 1 being the highest) average score in the nation.
A great example would be New Jersey, Delaware, and Maryland. All three are physically contiguous and have populaces that enjoys Electronic music the most, with Jazz, Rock, and Rock being the 2nd most popular, respectively.
With Jazz and Rock having similar score ranges and a median difference of only 45 on a 1600 grade scale (under 3% of the total possible score) and their physical locale taken into account, you’d expect these states to rank similarly in the nation. The truth is almost as opposite as it could be:
- New Jersey – Rank 4
- Maryland – Rank 26
- Delaware – Rank 46
They almost cover the entire spread of the possible ranks. This cannot be attributed to the data. Perhaps the 3rd most popular genres have fans who’s scores are extreme outliers affecting the average.
Perhaps each state has a different culture of partying and self-discipline in their high schools and universities. The states may carry a different focus on the importance of standardized testing.
Another fun piece of data included is the Top 25 cities according to MMI rank (Metro Music Index). This represents the density of music-related businesses and number of musicians who live in each city.
The higher the concentration, the more productive the city is for the music industry. We find that these city location don’t correlate with the nation rank of the states they exist in nor do are they dominated by any set of genres. Everything is evenly distributed.
OTHER CONTRIBUTORY FACTORS
The data does correlate and the question becomes why. The University of Texas dealt with this question when it created the STOMP test, the Short Test of Music Preferences. As we discussed before, the conclusion surrounds two main reasons we choose the genres we do:
- Suitability to Mood & Activity
- Impression Management
In layman’s terms this means that we choose music that helps us integrate and understand our dominant and habitual emotions and also to project a certain image of ourselves to others.
Some of us want to fit in while others want to rebel. Some are full of angst or anger while others are working out the ramifications of social relationships such as break-ups, loyalty, and betrayal.
Interestingly, the genres naturally clustered themselves into four main categories:
- reflective & complex – e.g. classical, jazz, folk, blues, alt & indie
- intense & rebellious – e.g. metal, punk, rock
- upbeat & conventional – e.g. electronic, latin, bluegrass, R&B & soul
- energetic & rhythmic – e.g. country, pop & rap
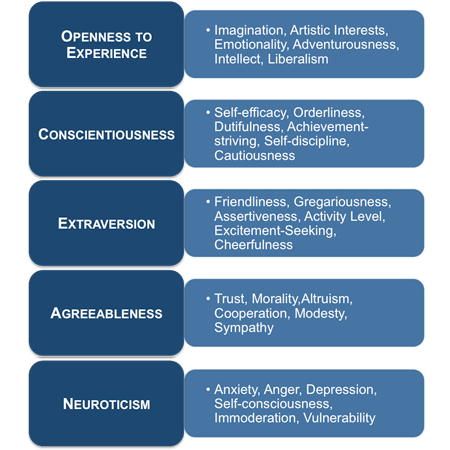
Discovering this required the same sample population to take a “Big Five” psychological exam to map them against the five factor model related to personality. The acronym for the five personality traits is OCEAN:
- Openness to Experience
- Conscientiousness
- Extraversion
- Agreeableness
- Neuroticism
Extraverts tend to enjoy “party music.” Neurotics and introverts tend to enjoy reflective and complex music. Conscientious people gravitate to rebellious music.

These types of results do well to help explain the correlation between SAT score and musical preference. But lest we place too much importance on the SAT, let us remember…
“The SAT is not perfect. We all know smart, knowledgeable people who do badly on standardized tests. But neither is it useless. SAT scores do measure both specific knowledge and valuable thinking skills.”
Give it a real shot, despite your musical preferences or standardized test taking skills and test anxiety. There’s a lot about you to leverage in your career later besides a number from some test you took forever ago.
No adult in the real world cares about your test scores, only about how effectively you can perform your job and contribute to society. Don’t stress it too much.
Collection & Calculation Methods
This meta-analysis owes its thanks to the following resources and their sophisticated collection and calculation techniques:
Resources:
- Bureau of Labor Statistics. Occupational Employment and Wages, May 2015, 27-2042 Musicians and Singers. U.S. Department of Labor, 2016. www.bls.gov/oes/current/oes272042.htm. Accessed 9 Oct. 2016.
- Griffith, V. Musicthatmakesyoudumb. California Institute of Technology, 2009, musicthatmakesyoudumb.virgil.gr. Accessed 10 Oct. 2016.
- Miller, Geoffrey. Spent: Sex, Evolution, and Consumer Behavior. Viking Adult, 2009.
- Mizell, L., Crawford, B., & Anderson, C. “Music preferences in the U.S.: 1982-2002.” National Endowment for the Arts. 2005.
- Postrel, V. The Future and Its Enemies: The Growing Conflict Over Creativity, Enterprise, and Progress. Free Press, 1998.
- Rentfrow, P.J., & Gosling, S.D. “The do re mi’s of everyday life: The structure and personality correlates of music preferences.” Journal of Personality and Social Psychology. vol. 84, no. 6, 2003, pp. 1236-1256
- Rentfrow, P.J., Mellander, C., Florida, R., Hracs, B., & Potter, J. “The geopraphy of music preferences.” Martin Prosperity Research. 2011.
- U.S. Department of Commerce. Bureau of Economic Analysis. bea.gov. Accessed 9 Oct. 2016.
- U.S. Department of Education, Institute of Education Sciences, National Center for Education Statistics. Digest of Education Statistics, 2014. vol. 2016, no. 006, table 226.20.
Using data collected by the groups and authors above we were able to use simple statistical methods to coerce the data into visually digestible graphs, charts, and maps.
Don’t let your taste in music scare you or inflate your confidence regarding the SAT. It’s not thatserious, but definitely grab your best studio headphones, turn on your playlist from your favorite genre, and get studying! Good luck!
Share this post with your friends using the social media buttons below to freak them out about their crappy taste in music!