They're designed well and make nice posters for a school classroom. They get a lot of re-pins on Pinterest. Halfway interested amateurs pass them around because they seem profound and packed full of useful information.
Except they aren't.
Your first clue that these abominations suck are the instrument frequency charts that purport to show the fundamental frequency ranges as well as the harmonics of every common instrument you might mix.
They then go on to tell you that the 'honk' of a saxophone occurs 'somewhere' between 150 Hz and 550 Hz. First off, what is the sound of a 'honk' and why does it exist in such a broad range of frequencies?
So you consult a different chart that doesn't mention 'honk' at all, but you do learn that the 'woof' of a saxophone exists in the range of 200 Hz to 300 Hz, which has a little crossover with the 'boom' and a lot of crossover with 'mud.'
It's starting to make sense... not the chart, but the fact that every piece of data on it is subjective, changes based on the recording techniques, and some of it is flat out untrue. It turns out that these are just marketing images made by people who likely haven't mixed a song in their life.
In the cases where the information is accurate, it's usually unusable or should be avoided. Below, we'll show you a few examples of these kinds of audio frequency charts and explain the problems with them.
Lots of newcomers to the world of equalization and mixing encounter these charts, and we need to set the record straight. The main issue with these types of charts are the effect they have on the amateur mixer who honestly is attempting to learn and increase his or her skill level.
EQ cheat sheets teach the worst possible technique to a mixing engineer - they teach you to mix with your eyes instead of your ears.
This carries over from the cheat sheets on to the user interfaces on parametric equalizer plugins, the volumes bouncing on fader meters, the graphs of gain reduction on compressors, and more.
Here's an analogy of how bad this is before we get into the specifics. Imagine being taught to type on a computer keyboard.
Of course you have to look at an image of a keyboard first to begin learning where each letter is situated. But the images only say "the letter you're looking for is somewhere in this area on one of these keys and here's a nickname for the letter instead of the actual name for the letter."
Not only is that a disaster but it traps you. You have to continue looking at the chart because the information isn't specific enough to learn from, so your typing speed never increases because you never learn to not look at the keys and at the chart. You never gain freedom from the tyranny of the teacher.
Let's understand exactly what these charts are supposed to be achieving and then explain specifically the problems they create and how to actually solve these issues.
What Is An EQ Cheat Sheet?
An EQ cheat sheet, also called an instrument frequency chart or an audio frequency chart, is an infographic that displays the supposed frequency responses of every common instrument laid out across the frequency range of human hearing.
They also provide tips regarding fundamental and harmonic frequencies, subjective sounds like 'squeek' and 'presence,' and even information on the influence of certain types of microphones when recording.
Most of the time, all or large portions of this information on these graphics are inaccurate and useless, but they seem sophisticated and insightful to newcomers due to the vast amount of info crammed onto them in an admittedly attractive format.
They serve one purpose, which is to sabotage your ability to mix music on a professional level.
Instrument Frequency Chart Examples
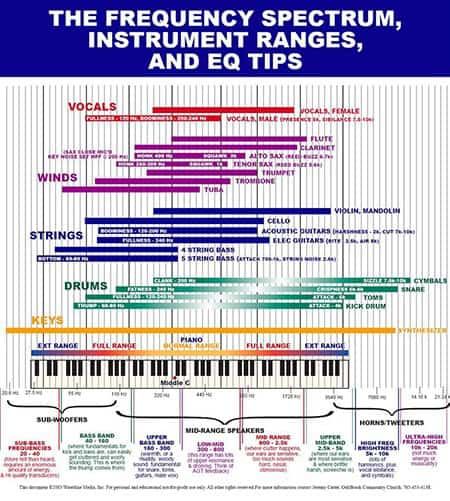
Let's look at a few of these monstrosities. The first is from LANDR, a company that uses algorithms to 'read' your song and apply presets to master your music for a couple bucks per track. If that sounds like a good idea to you, then you'll probably love this equalization cheat sheet they made:
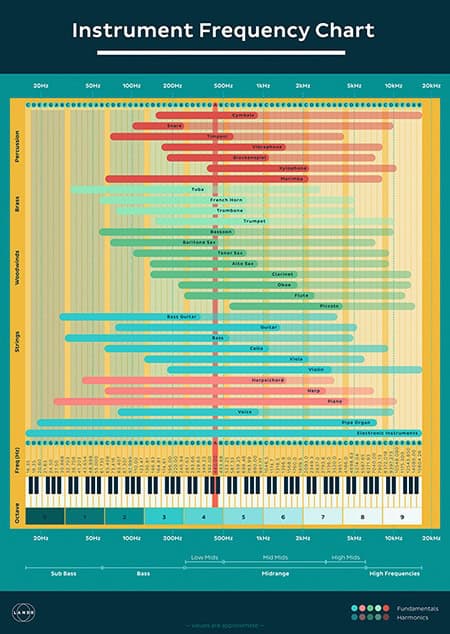
I'll admit that this one simply presents information without making any suggestions about using it for equalization purposes. It's just sharing instrument frequency ranges in a pretty fashion. You can't hurt yourself too bad by reading this one.
What they did do well was lay out a piano keyboard along the bottom and show which keys belong in which octave and the frequencies of each key. They also explain which regions are sub-bass, bass, midrange, and high-end.
But that's also in the realm of 'ABC 123,' which lets you know who these charts are aimed at impressing. This above chart is visually attractive and pragmatically useless. NEXT!
This abomination originates from a sound guy at a church. It's been around since 2003 and keeps getting lower and lower in resolution to the point that I can't read the credits on any of the copies out there.
Like the first one, this chart explains the various regions of the frequency spectrum but goes further by describing things that happen within them like 'warmth,' 'woody,' and 'clutter.'
It's full of words like sizzle, crispness, fatness, clank, and squawk. Interestingly, depending on the instrument those exact same words will be used thousands of hertz of frequencies apart. BOO!
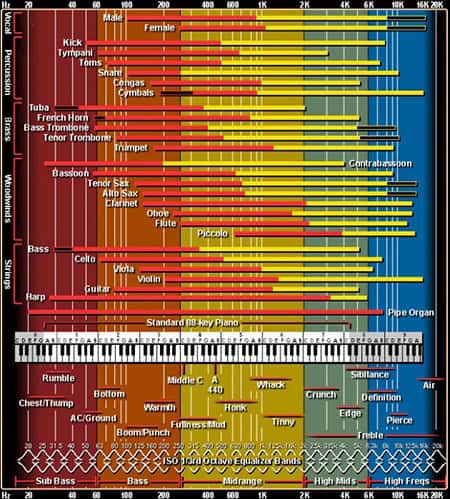
This is another oldie, but goodie that has been added onto and taken away from over the years.
Instead of harping on what it does wrong (like being an eyesore), we can at least point out one thing they did right that we'll discuss later, which is assigning these subjective names for tones to specific frequency ranges like they should be, instead of acting as if they change and move around depending on the instrument.
These are real terms that people use to communicate when mixing that you'd do well to be a little familiar with. We explain what most of them mean in our discussion on guitar tone.
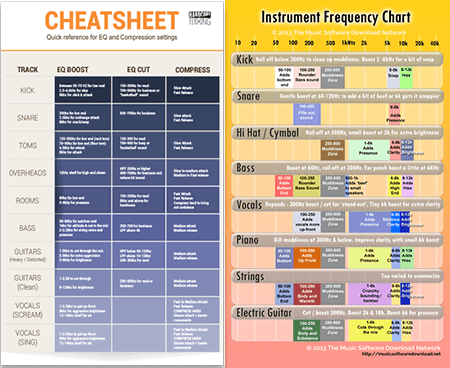
Here are two of the worst offenders. These kind are so absurd that they don't just give ranges of guidelines of where to equalize your tracks, but they tell you to do it to each track whether they need it or not.
But it doesn't stop there, the one on the left tells you what compression settings to apply to each instrument. You simply cannot mix like this. It's like a doctor giving every patient the same medicine, no matter what illness they're dealing with. It's stupid.
The Problem With Mixing Frequency Charts
We can summarize the issues with all of these cheat sheets you see out on the internet in a few bullet points:
- Most pretend to have useful information but don't.
- The information presented is subjective with no explanations.
- The suggestions are too broad to be pragmatic.
- The guidelines are too specific to accommodate the uniqueness of every song.
- Half of the info is only tangentially related to mixing or EQ.
- They set up the mixer for the bad habit of mixing with their eyes instead of ears.
- They always want you to boost instead of cut when EQing.
If you've ever mic'd a vocalist or guitar, you'll know that even the slightest movement in the position of the microphone can drastically alter the sound captured, which means a completely different set of frequencies are being recorded at different volumes.
You simply can't treat all of these recordings the same, and that's with the same mic and instrument on the same day 5 minutes apart, let alone changing all of that and pretending you can mix them the same.
And the main issue with these is that:
They all act as if you're mixing your tracks in solo mode and will never mix them together (also known as 'mixing a song').
It doesn't really matter how any instrument sounds in isolation. The only thing that matters is the end result of all of the tracks mixed down together, and these charts don't deal with that context at all, which is at least 90% of the art of mixing.
How to Properly Learn to Find Problem Frequencies
Consulting a chart can be okay as an absolute beginner who has no idea at all about what sounds lie in which frequency ranges. But once you get even the most basic lay of the land figured out, you need to practice by actually mixing.
By hunting for problematic frequencies in the sounds you're mixing, you're giving your brain context in which to solidify your learning. By using a bandpass filter or parametric equalizer with a tight Q boost, you can sweep up and down the frequency spectrum until the bad sound pops out at you.
Then you can take note of where it was. This is the slow, steady, and sure way of training your ears for mixing. No chart can replace time and effort.
Alternatively, you can find quizzes online for ear training, study with YouTube videos designed from signal generators, or even sit down in front of a full-length piano or keyboard and plink out the keys as you focus intently.
The main goal is to be in the ball park. You want to be able to hear a frequency and know within a smaller and smaller plus-or-minus variance of where that frequency lies on the spectrum.
You don't need perfect pitch, but getting close speeds up your mixing. Even professionals sweep their EQ's to find the exact frequency.
Yes, to summarize, I'm telling you that there are no short cuts. You have to practice!
There's no magic chart out there that will turn you into a world class mixer, just like looking at a poster of guitar chords won't mean that you can suddenly play them. Nothing replaces practice.
Real Frequency Spectrum Guidelines
All you really want to do is to be able to hear a frequency that you like or don't like and be able to identify which range it falls in in the table below. If you can do that, you're golden in terms of EQ speed and skill.
| Region Name | Frequency Range |
|---|---|
| Sub-Bass | 20 Hz - 60 Hz |
| Bass | 60 Hz - 250 Hz |
| Low Mids | 250 Hz - 500 Hz |
| Midrange | 500 Hz - 2 KHz |
| Upper Mids | 2 Khz - 4 kHz |
| Presence | 4 kHz - 6 kHz |
| Brilliance | 6 kHz - 20 kHz |
It does help to have an explanation of each region of the audio spectrum so you can begin to make associations that help you learn them for good.
Sub-Bass: 20 Hz - 60 Hz
The sub-bass region is comprised of the lowest frequencies humans can hear. Although they can be heard, their vibrations can also be felt physically. This feeling delivers the sense of power in a mix, an impact which can only be experienced with a good subwoofer.
Few instruments besides bass guitars and other bass-focused instruments reach this deep into the frequency spectrum. You can remove a lot of noise and rumbles from a mix by high-pass filtering most tracks to cut out this region.
Bass: 60 Hz - 250 Hz
The bass region is where you control the sense of 'fatness' and 'thickness' of a sound and mix. Most bass and rhythm instruments have their fundamental frequencies situated here.
Too little volume here and a mix will sound 'anemic' and 'weak,' but too much and you'll venture into the territory of 'boomy.' This is where the battle between your kick drum and bass will occur, with each fighting for their own space without hurting the definition and clarity of the other.
Low Mids: 250 Hz - 500 Hz
The low midrange is one of the most vital regions of the spectrum due to its ability to control the sense of 'muddiness.' Too much volume here will create a 'muffled' and 'boxy' mix, while too little can make a mix feel 'see through.'
In general, you will cut frequencies when equalizing here, generally with a medium-Q to create smooth scoops. This is typically the fault of a lack of acoustic treatment in the recording environment.
Midrange: 500 Hz - 2 kHz
The midrange is one of the most sensitive regions when seeking to impact an instrument's or vocal's prominence in a mix without adjusting volume too much, along with the upper mids.
Care should be taken to never boost too much here and to focus on cutting elsewhere, or you risk creating a sense of 'honk' as mentioned above.
Boosting too much towards 1 kHz to 2kHz can become 'tinny' and lead to ear fatigue in the listener. Often you won't do too much here, as most tracks don't need to be the lead (except for the actual lead).
Be extra careful in this 1 kHz to 2 kHz range because our sensitivity to these frequencies changes depending on the volume. They can easily become too loud or not loud enough if you don't check your mixes at differing volumes. This sensitivity is shown and explained by the Fletcher-Munson Curve.
Upper Mids: 2 kHz - 4 kHz
The upper mids are similar to the midrange in that so much tonal activity is crammed in here that the smallest boosts and cuts can create relatively drastic changes in a mix, especially for vocals, guitar, and the attack of percussion instruments.
Along with the next region, boosts here can create a sense of 'solidness' or 'presence,' which are important for prominent lead tracks.
Presence: 4 kHz - 6 kHz
The presence range is responsible for clarity, intelligibility, and general definition of most non-bass sounds.
For instance, combined with compression, presence can help a vocal track stand out in the mix by providing a sense of 'solidness' and 'hardness' to the recording. Too much can become irritating, while too little can make a sound feel distant, un-engaging, and transparent. Knowing how to EQ vocals is a science, but doing it is an art.
Brilliance: 6 kHz - 20 kHz
The brilliance region is where the 'sparkle' and 'air' of a track lies. It's mostly very whispy, containing only harmonic frequencies in the upper region.
Boosts here should be performed with a very wide-Q or a shelf. If you boost too much you will increase the volume of hiss noise, create piercing cymbals, sharp guitars, and intolerable sibilance. If you boost just right you'll add a flair of high fidelity to your mix.
Conclusion? EQ Cheat Sheets Suck
Don't get trapped or thrown off course by these charts. Unless you've never spent a single moment considering that low frequency sounds occur in the bass region and high frequency sounds occur in the upper regions, then you have zero reason to look at these charts.
Yeah, they're pretty, but that's about it. Nothing will or can replace the time you spend in front of your monitors actually mixing and listening with your ears. These EQ cheat sheets want you to use your eyes, which is an absolute no-go.
Jared H.
 Jared has surpassed his 20th year in the music industry. He acts as owner, editor, lead author, and web designer of LedgerNote, as well as co-author on all articles. He has released 4 independent albums and merchandise to global sales. He has also mixed, mastered, & recorded for countless independent artists. Learn more about Jared & The LN Team here.